US stock technical analysis: Google GOOG
Analyzing the world largest search engines Company Google. Google can be akin to “Might is right” in the business line.
Being slow, you lose the advantage at the starting point.
Similarly to stock investments in the market. Are you still wasting your time doing companies’ fundamentals analysis, or using complicated technical analysis charts to analyze stocks’ trend?
All these are actually obsolete and non-effective now. Let’s look at the latest available investment software.
The latest technical analysis: Google Inc. GOOG
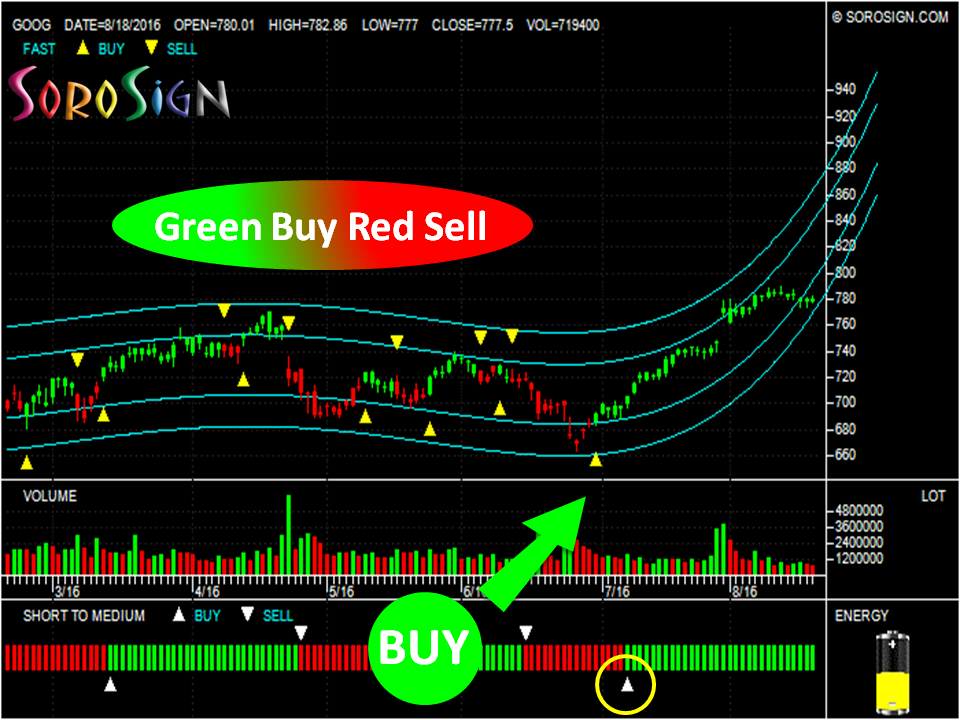
Google can provide you search results within half a second time, so are our software SoroSign! With just a click on SoroSign, a perfect analysis chart is displayed.
With this smart technical analysis software, investors are directly guided to buy low and sell high. The signals are very simple to use, green buy, red sell.
Just follow the steps below to trade:
# 1: OLA blue line show upward trend – predict the future trend is upward.
# 2: Green buy signal (Short to Medium) appeared, – buy.
# 3: OLA trend line turn down – predict the future trend is downward.
# 4: Red sell signals (Short to Medium) appeared, – sell.
SoroSign – The Simplest Investment Method – Magic Weapon to Win More Lose Less
Free enquiry hotline: (6) 012 – 475 7723 / 04 – 8913 200
WhatsApp : 012-475 7723

